


My AdSense Account Was a Mystery Box of Failure. Then Analytics Gave Me the Clues.
I had two tabs open on my browser that I was legitimately afraid of.
The first was my AdSense dashboard. I called it the Tab of Shame. It was where I went to see, in excruciatingly precise detail, how little money my blog was making. A few cents here. A dollar on a good day. It was like a constant, numerical whisper telling me I was a failure.
The other was Google Analytics. I called that one the Wall of Confusion. It was a chaotic mess of charts, graphs, and words I didn’t understand. “Bounce Rate.” “Session Acquisition.” It looked like the flight deck of the Starship Enterprise, and I felt like a caveman who had just been handed the keys.
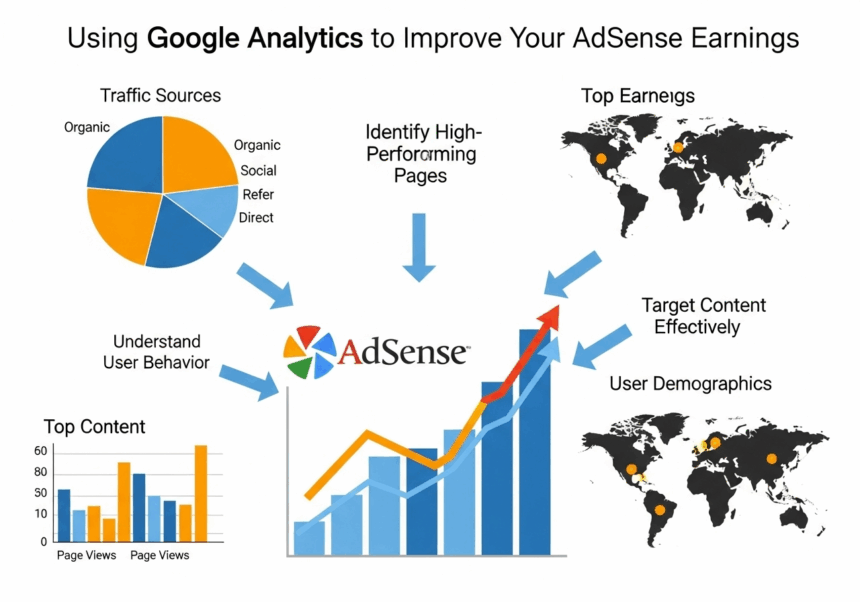
I knew, on some intellectual level, that these two things were supposed to be connected. I’d read articles with titles like Using Google Analytics to Improve Your AdSense Earnings. It sounded so smart. So professional.

But for me, they were just two different flavors of anxiety. One told me I was broke. The other showed me a bunch of squiggly lines that I had no idea how to interpret. They were two separate, silent judgments.
This isn’t a guide from a data scientist. I am not a data scientist. I still get a little dizzy when I look at a spreadsheet. This is just the story of how I stopped being terrified of all those numbers and graphs, and how I finally, painfully, figured out how to use them to find some actual answers.
My First, Clumsy Foray into the Data Mines
My early days with Google Analytics were a joke. I knew I was supposed to have it. Every “How to Blog” article from 2012 said so. So I did the thing. I copied the little tracking code, I pasted it into my website’s header like a good little boy, and I promptly ignored it for six months.


Every once in a while, I’d get brave. I’d log in. I’d see a big graph that mostly went up and to the right, and I’d think, “Hey, cool! People are visiting my site!” Then I’d see a bunch of other numbers I didn’t understand, feel a wave of inadequacy, and quickly close the tab to go look at pictures of cats on the internet instead.
What was I supposed to do with it? It felt like I’d been given a giant, powerful microscope, but I had no idea what I was looking for. I was just staring at a blurry, meaningless slide. I was trying to figure out the AdSense reports in Google Analytics, but I didn’t even know what a good report was supposed to be.
Then I read an article that said the very first step, the absolute-must-do-this-right-now thing, was linking AdSense to Google Analytics. It sounded simple enough. There’s a button you have to find deep in the settings, but I found it. I clicked it. I felt very accomplished.
I waited a few days and logged back into Analytics, expecting a chorus of angels and a clear, divine message from the heavens. “Here is how you make more money,” the data would sing.
Instead, all I got was more static. More charts. “AdSense Impressions.” “AdSense Clicks.” It was just my Tab of Shame, but now it was living inside my Wall of Confusion. I hadn’t solved a problem; I had just created a slightly more complicated problem.
My next genius phase was when I decided to just ignore everything except the one big, shiny number I understood: Users. Traffic. Eyeballs. My only goal became to make that number bigger.
And I did. I got a little desperate. I wrote a few posts with clickbait-y, outrage-stoking headlines. I spent hours spamming links to my articles in Facebook groups. My traffic number went up. I felt a fleeting, hollow sense of victory. I was a “high-traffic blogger”!
But then I’d look at my AdSense account. And nothing. The number wasn’t moving. In fact, on some of my highest traffic days, my earnings actually went down.

How is that even possible? It felt like a cruel joke. I was getting more people in the door, but I was making less money. It made no sense.
I was chasing a ghost. I was so obsessed with getting more people to my site that I never stopped to ask if they were the right people. They weren’t. They were angry people who wanted to yell in my comments, or bored people who had been tricked into clicking. They weren’t readers. They were bounces. They’d show up, realize this wasn’t what they wanted, and leave in a huff. And advertisers, it turns out, don’t pay for angry, fleeting ghosts.
The Lies About “Data” That Kept Me Feeling Dumb
After the “high traffic, no money” disaster, I was done. I was ready to disconnect Analytics and just go back to my blissful ignorance. I decided data was stupid.
The truth is, data isn’t stupid. But a lot of the advice about how to use it is. It’s written by analysts for other analysts. It’s full of terrible assumptions that keep normal, non-data-brained people like me feeling overwhelmed and inadequate.
The “You Need to Track Everything” Myth
This is the first trap, especially with the newer Google Analytics 4. It’s so powerful. You can track literally everything. Every click. Every scroll. You can set up fifty different “custom events.”
And this power makes you feel like you should. You feel like if you’re not tracking every conceivable interaction on your site, you’re a bad marketer. A slacker.
So you do it. You set up all the tracking. And you end up with a mountain of data. A beautiful, glorious mountain of utterly useless information.
You don’t need to know how many people from Finland scrolled 82% of the way down your About page. It’s a fun fact, I guess. But it’s not a clue. It’s just noise. And when you have too much noise, you can’t hear the signal.
The “Data is God” Lie
We’re taught to treat data as the ultimate truth. The numbers don’t lie.
And that’s true. But they don’t tell the whole truth.
Data tells you the what. It never tells you the why.
Analytics could tell me, for instance, that a particular blog post had a super high “bounce rate.” That was the “what.” People were leaving that page almost immediately.
But it couldn’t tell me why. Was the article badly written? Did the page take forever to load on a phone? Was there a giant, obnoxious ad right at the top that was scaring people away?
The data is just the smoke. It’s not the fire. Your job isn’t just to be a data-reader. Your job is to be a detective. The data tells you where the crime scene is. You still have to go there yourself and figure out what happened.
The “Just Focus on Your Most Popular Posts” Lie
This one sounds so smart, so logical. “Find the pages that are already getting the most visitors, and put more ads on them to maximize your revenue!”
It’s a classic 80/20 rule application. And it’s what I did for months. I had one or two posts that got a ton of traffic from Pinterest. So I loaded them up with ads.


And my earnings barely budged.
It was infuriating. It took me a year to understand why. It was because I wasn’t analyzing traffic sources for AdSense properly. I was treating all visitors as if they were the same. But a visitor from Pinterest is on a completely different psychological wavelength than a visitor from Google.

The Pinterest visitor is in a “browsing, dreaming, someday” mindset. The Google visitor is in a “My house is on fire RIGHT NOW, and I need a fire extinguisher” mindset.
That second person is infinitely more valuable to an advertiser. They are an active, engaged problem-solver. The first person is a window shopper.


Analytics showed me this with brutal clarity once I knew where to look. My “most popular” pages were actually some of my least profitable. The traffic was popular, but it wasn’t valuable.
The “Aha!” Moment That Made the Numbers Make Sense
I was so intimidated. The sheer volume of data in Google Analytics felt hostile. I was focused on the numbers themselves, on the abstract metrics, on the charts.
The breakthrough, the moment the light finally switched on in my brain, was when I stopped looking at the numbers as numbers.
And I started trying to see them as people.
The big idea, the thing that unlocked it all for me, was this: Google Analytics isn’t a spreadsheet. It’s a book of stories. It’s a collection of clues about the thousands of real human beings who have visited my little corner of the internet.
My Old, Flawed “Data Analyst” Mindset
For so long, I was trying to be a data analyst. I was looking at my Analytics dashboard and thinking, “My job is to make the ‘Users’ number go up and the ‘Bounce Rate’ number go down.”
It was a cold, impersonal game. It was about manipulating the metrics.
It’s like I was a retail store manager, and instead of ever actually walking around my store and talking to my customers, I just sat in my office and stared at the sales reports. I could see that no one was buying the sweaters in the back corner. But I had no idea why. Maybe the lighting is bad back there. Maybe they’re hidden behind a rack of ugly coats. Maybe they’re just ugly sweaters.
I could see the “what” (sweaters not selling), but I couldn’t see the “why.”


My New Mission: Become a “Customer Detective”
So I stopped trying to be an analyst. And I started trying to be a detective.
Every number in Analytics represented a real person. A person with a problem, a question, a need. My new mission was to understanding your audience in Analytics by looking for the clues they were leaving behind.
Who are these people? Where are they coming from? What are they looking for when they arrive? What do they love? What bores them to tears? My Analytics account transformed from a wall of scary numbers into the most fascinating book I’d ever read. It was a book full of mysteries, and my only job was to follow the clues.
Just Ask Good Questions” Guide to Using Analytics for AdSense
So what does being a “detective” actually look like?
This isn’t a technical guide to every report in GA4. This is just my simple, three-question investigation that I do every month. It’s the process that turned Analytics from a source of anxiety into my most valuable tool.
Question 1: “Who is in the room?” (Finding your real audience)
The first thing I look at is the Demographics report. Age, gender, country. It sounds basic, but it’s the start of the story. I discovered that while I thought I was writing for people like me (guys in their 30s), my actual audience was overwhelmingly women aged 45-60. Whoa. That single piece of information changed everything. It changed the way I write, the examples I use, the problems I try to solve.Question 2: “How did they get to the party?” (Finding your best guests)
Next, I go to the Traffic Acquisition report. This is where the gold is. It shows me a clean breakdown of where my visitors are coming from. Google search. Pinterest. Facebook. Direct visits. And, crucially, once you’ve linked the accounts, it shows you the AdSense earnings per source. I saw, in stark, undeniable numbers, that one visitor from Google was worth fifteen visitors from Facebook. That single insight gave me permission to stop wasting my energy on Facebook and to pour all my effort into what was actually working: SEO.Question 3: “Which room at the party is the most fun?” (Finding your money-makers)
This is the part that feels like a treasure hunt. This is how I started identifying high-earning pages. In the Monetization or Pages and Screens report, I can see a list of every single one of my blog posts. And I can sort that list by AdSense revenue. This was shocking. My most profitable articles were almost never my most visited ones. They were usually older, slightly obscure posts that were ranking for very specific, very high-value search terms. Once I found these “money pages,” I treated them like gold. I made sure they were updated, perfectly formatted, and as helpful as possible. Then, I wrote more articles on those same topics. It’s like my own data was handing me a business plan. I also found a great article from Search Engine Journal that explained the nitty-gritty of tracking AdSense clicks in GA4, which you can find here. All of this, I learned, falls under the big umbrella of improving user engagement metrics. A site called OptinMonster had a really helpful, non-technical post on that here.
This three-question investigation is my entire analytics strategy. It’s not about being a data whiz. It’s about being a curious and empathetic host, just trying to figure out what your guests like so you can throw a better party next time.
So, Am I a Data Wizard Now? (Spoiler: Not By a Long Shot.)
The guy who was terrified of that wall of graphs and charts? He’s still here.

I still have no idea what half of the reports in Google Analytics are for. I still get that feeling of being a dumb caveman every time they change the interface.
But I’m not afraid of it anymore.
I’ve learned that it’s not a report card. It’s a book of clues.
It’s the most incredible, honest, and sometimes brutal feedback machine in the world. Every single day, people visit my site and they leave me a story, written in data. They tell me what they love, what bores them, what confuses them.


Using Google Analytics to improve your AdSense earnings isn’t about the numbers. It’s about learning to read the stories behind the numbers.
It’s the story of how to be a better writer, a better teacher, a more helpful human being.
And when you get that story right, the earnings report has a funny way of taking care of itself.
So, here’s my question to you. What’s the one story your own data is trying to tell you that you’ve been too intimidated to read? What’s the one clue you could start investigating this week?


